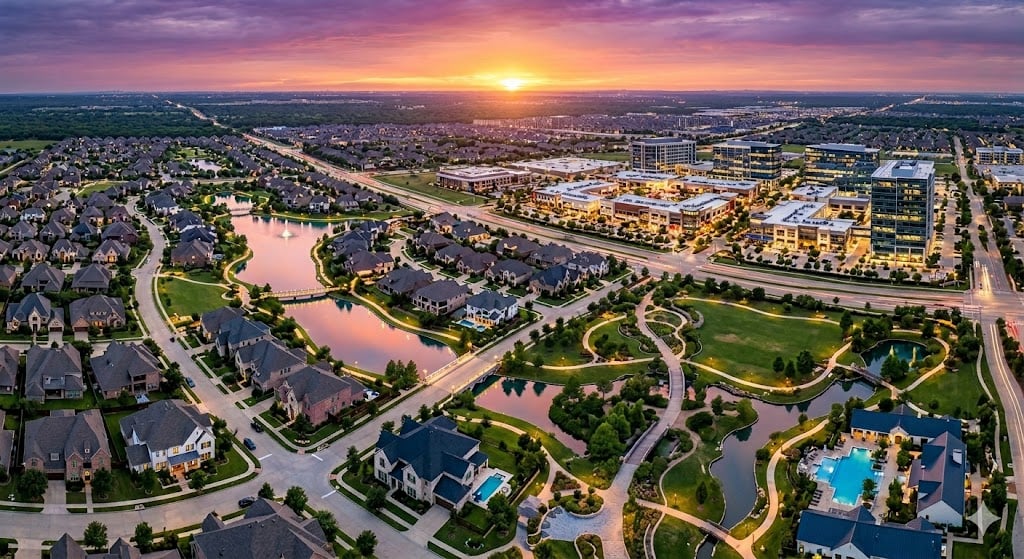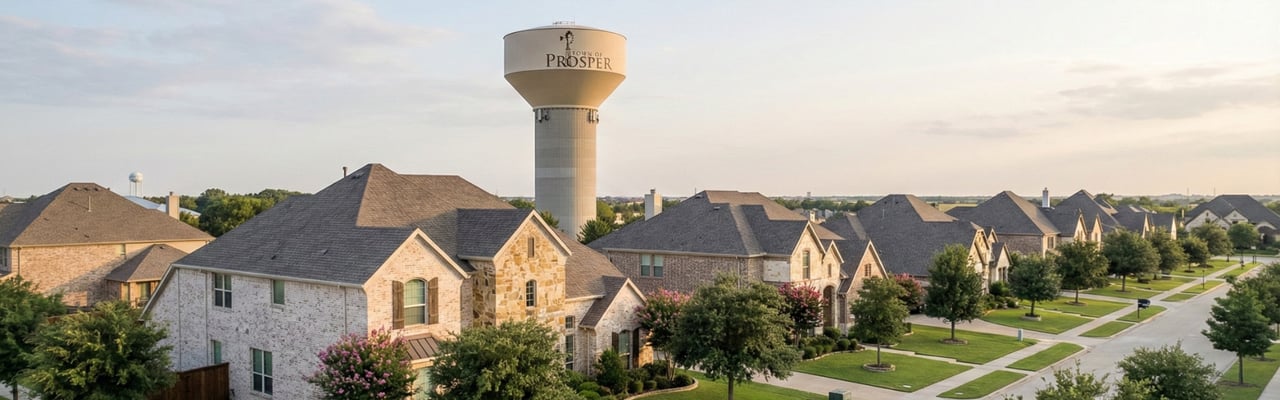
Prosper is one of North Texas’ fastest-growing communities, and it behaves differently than most suburbs because so much of the housing supply is newer, master-planned, and still expanding. That means lifestyle decisions and real estate decisions are tied together here, neighborhood choice, school zoning, amenities, commute patterns, and builder activity all matter.
This guide is designed to help you understand Prosper at the neighborhood level, not just the city level. You’ll see live demographic data, schools, and local points of interest below, and we’ll use a plain-English lens to explain what that data means in real life, and who Prosper is a strong fit for.
If you want the live housing numbers, inventory, pricing, and leverage indicators, use our Prosper Real Estate Market Report.
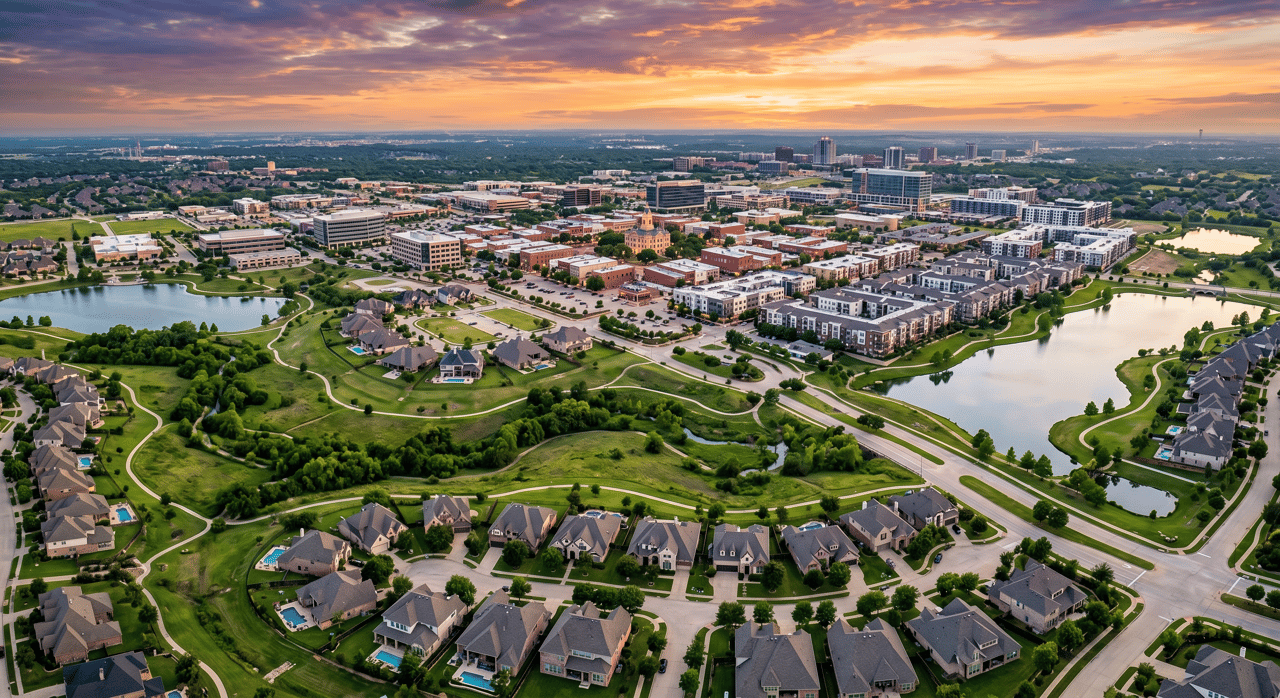
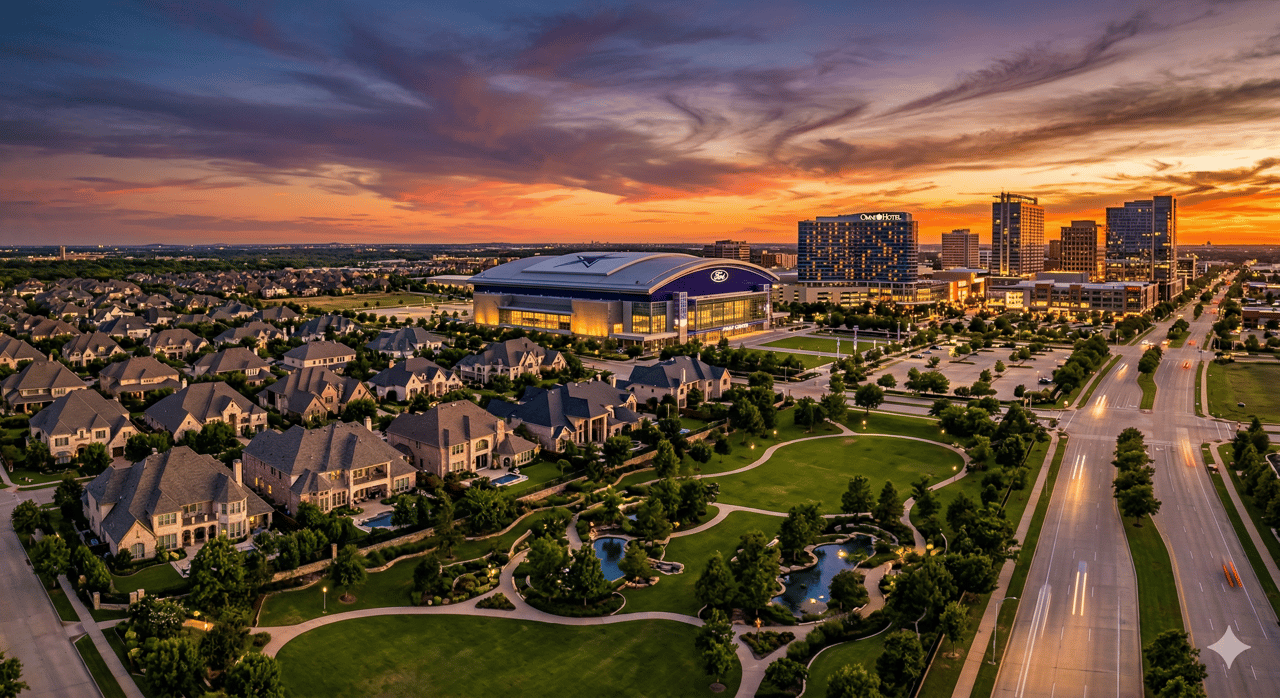
Garland, Texas is one of the largest and most established cities in the DFW metroplex, located northeast of Dallas. Known for its diverse housing options, strong employment access, mature neighborhoods, and affordability relative to many neighboring suburbs, Garland offers a combination of convenience, housing variety, and long-term residential stability across multiple price points.
The city has experienced decades of steady growth through residential development, commercial expansion, and continued investment in infrastructure. Unlike newer master-planned suburbs, Garland consists primarily of established neighborhoods, infill redevelopment, and resale-driven housing activity. This creates a housing environment influenced heavily by neighborhood-level dynamics rather than a single city-wide trend.
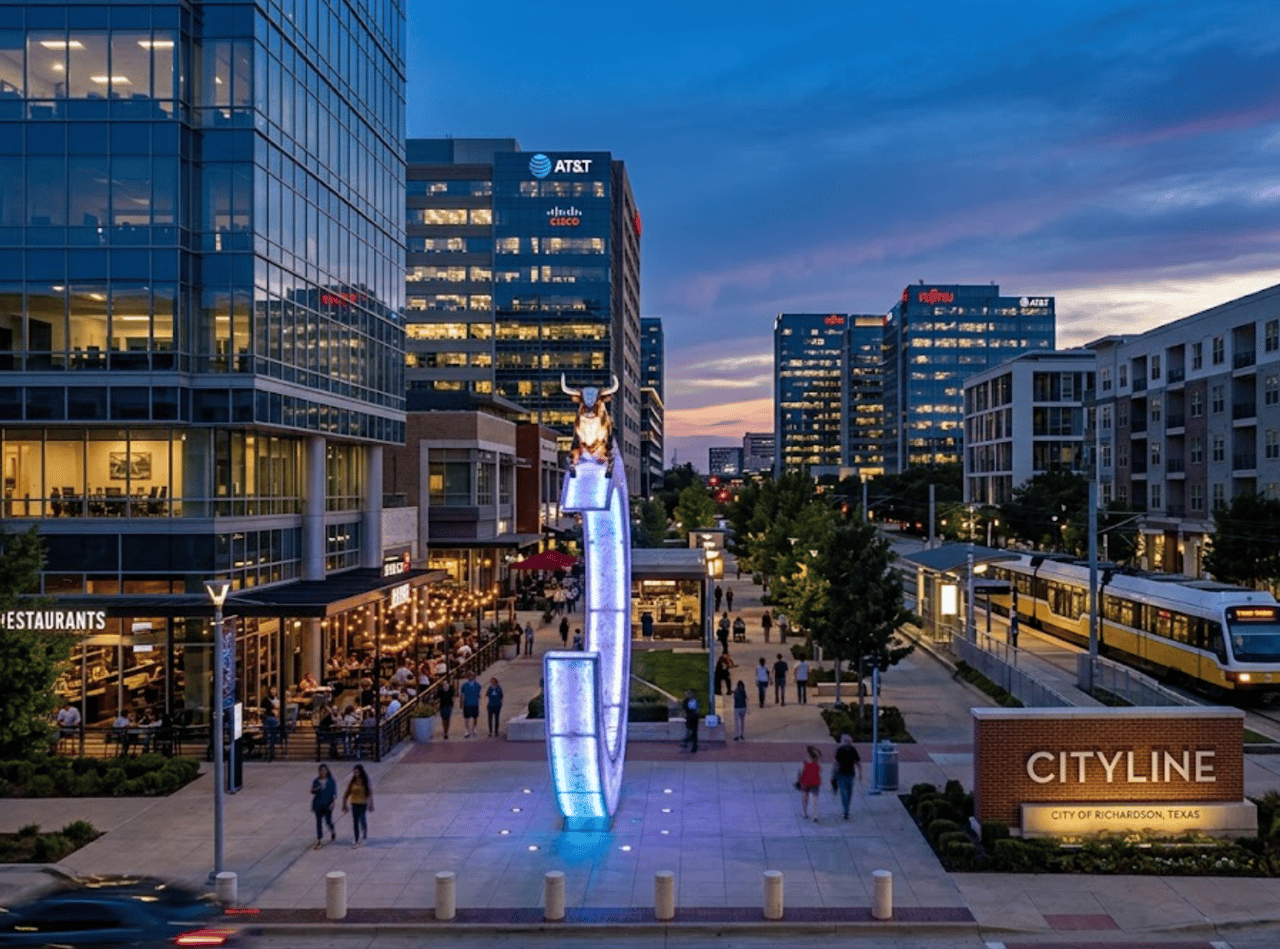
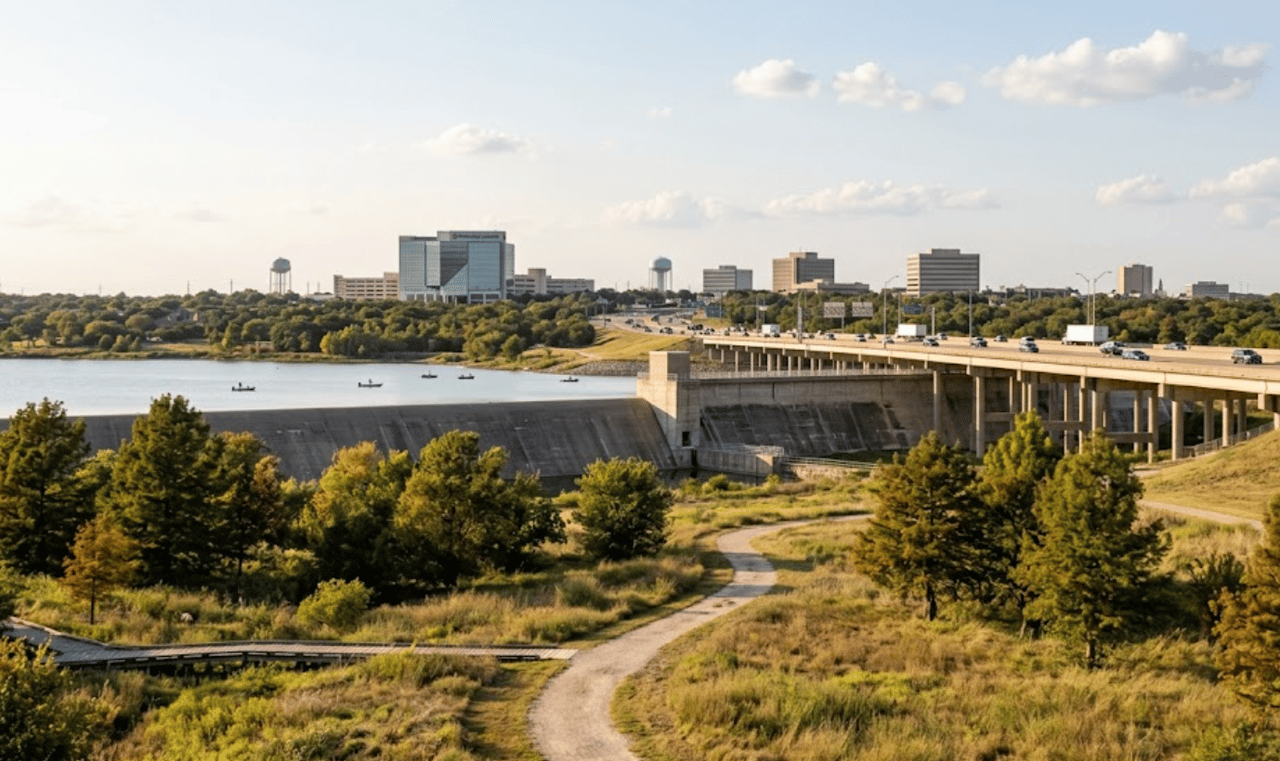
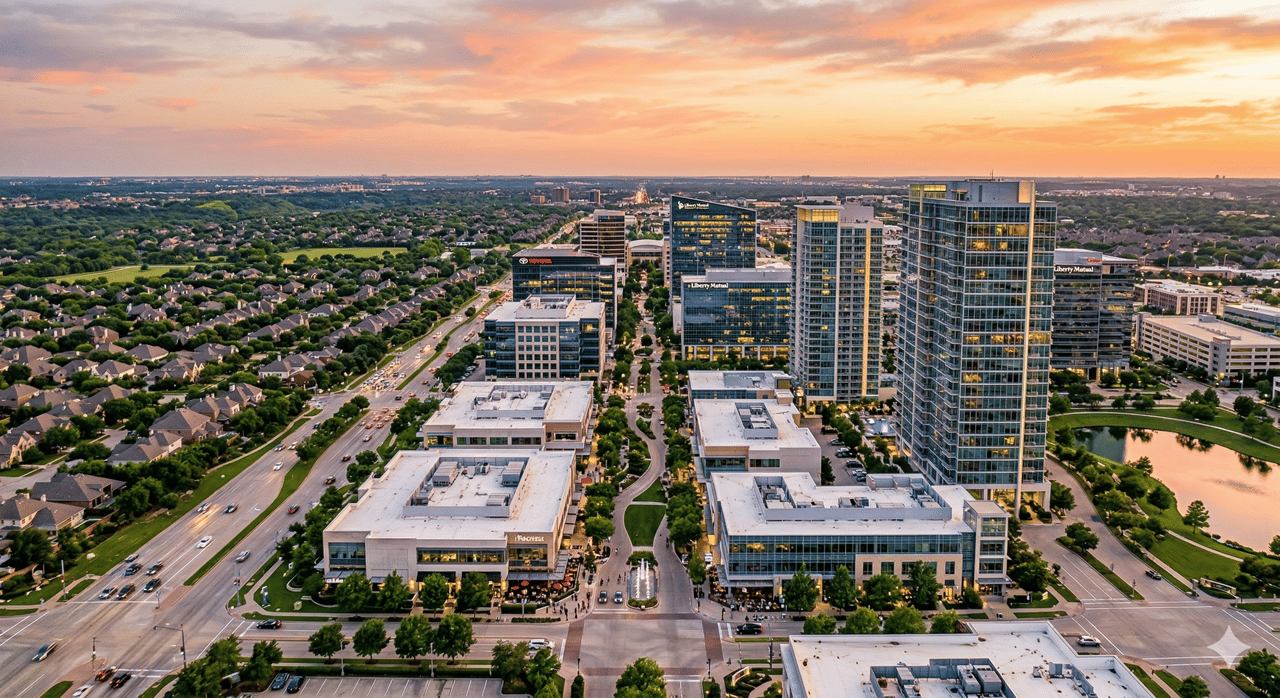
Buyers are often drawn to Garland for its central location, access to major highways including I-30, President George Bush Turnpike, and US-75, as well as its proximity to employment hubs throughout Dallas, Richardson, Plano, and North Texas. First-time buyers, move-up families, commuters, investors, and relocation buyers frequently target Garland for its balance of affordability, accessibility, and long-term value potential.
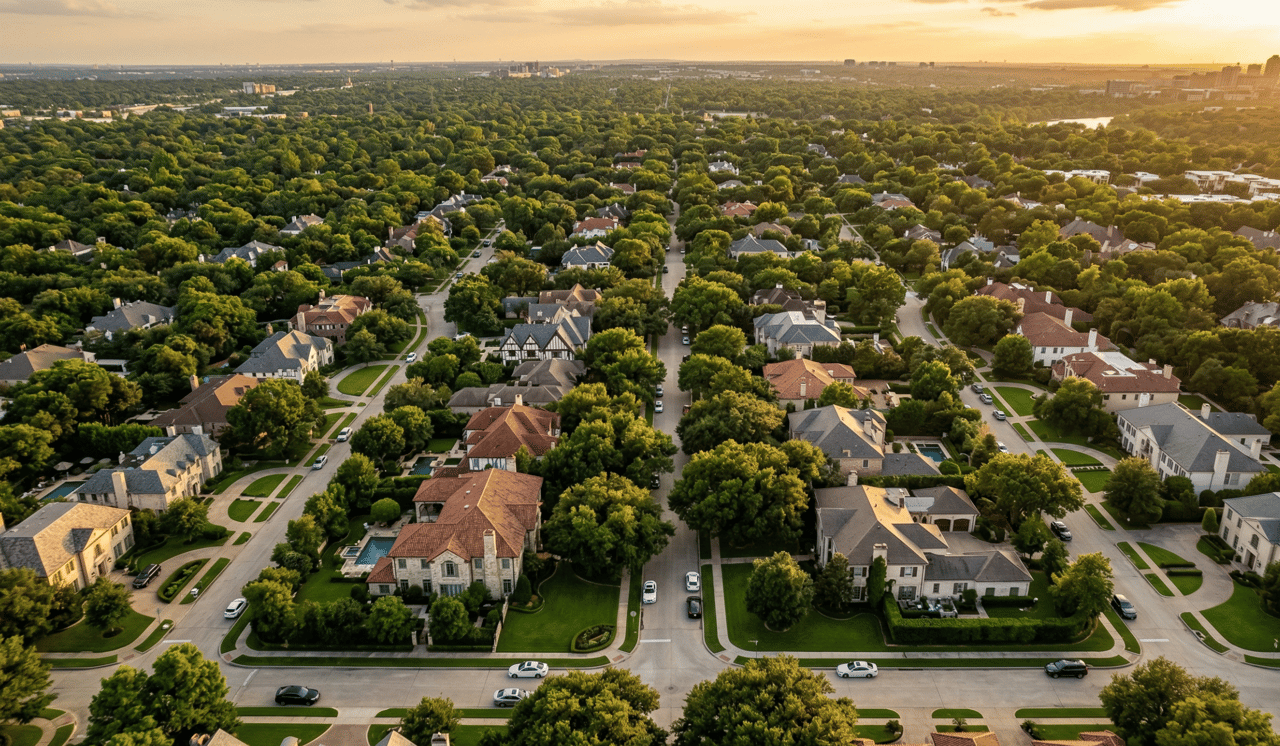
Housing in Garland includes a mix of established resale homes, renovated properties, executive neighborhoods, townhomes, and selective luxury communities. Pricing and market behavior vary significantly by neighborhood, school zoning, property condition, lot size, commute access, and inventory concentration.
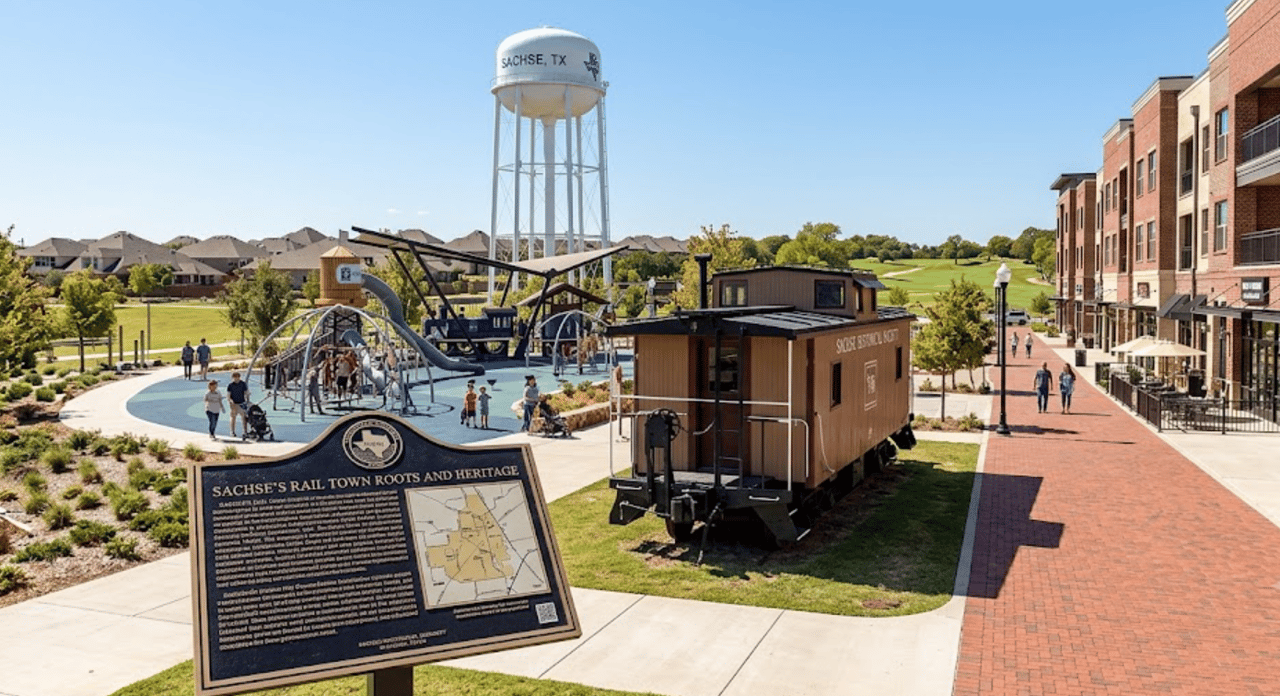
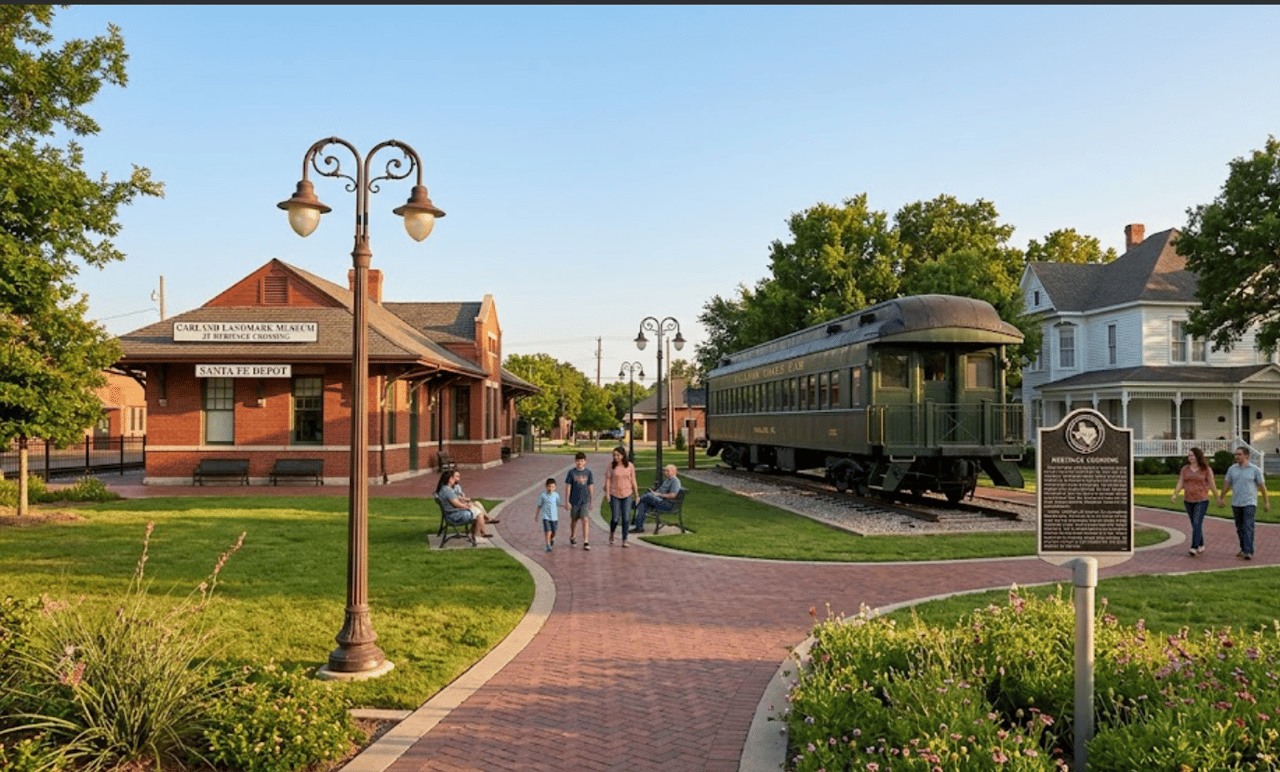
Garland is best suited for buyers who prioritize affordability, commuter convenience, housing flexibility, and established community infrastructure. Residents enjoy access to parks, recreation centers, golf courses, shopping districts, entertainment venues, and neighborhoods such as Firewheel, Club Hill, Valley Creek, Rosehill, and Springpark.
As Garland continues to evolve through redevelopment projects and ongoing infrastructure improvements, its market remains driven by neighborhood-level demand, inventory availability, and location advantages rather than large-scale development expansion. Understanding both the lifestyle and neighborhood-specific housing dynamics is essential when evaluating a move to Garland.
For live pricing trends and inventory data, view the Garland Real Estate Market Report.
Prosper is largely composed of master-planned communities and newer subdivisions. Absorption speed, pricing stability, and resale competition often vary by neighborhood rather than by ZIP code.
Windsong Ranch is one of Prosper’s most recognized master-planned communities. It includes resort-style amenities, extensive green space, and newer construction inventory. Because of its amenity concentration and branding, resale homes here often compete directly with builder spec inventory within the same price tier.
Star Trail includes a mix of luxury and upper-mid inventory. Larger floorplans and higher price tiers can result in longer absorption cycles compared to mid-tier neighborhoods. Price movement here is often influenced by high-end inventory stacking.
Whitley Place includes a combination of established homes and newer builds. Lot sizes and architectural consistency can influence resale positioning differently than fully new master-planned phases.
Lakes of La Cima represents an earlier development phase of Prosper. Homes here may compete differently against brand-new construction due to build era and amenity comparisons.
Prosper continues to expand through phased development. As new sections open in master-planned communities, inventory conditions can shift quickly within specific neighborhoods.
Subdivision-level analysis is critical when evaluating pricing and negotiation leverage in Prosper.
If you're preparing to buy or sell in Windsong Ranch, Star Trail, Gentle Creek, or surrounding communities, learn how our subdivision-level strategy works in our Best Realtor in Prosper guide.
244,806 people live in Garland TX Community & Neighborhood Guide, where the median age is 34.8 and the average individual income is $31,471. Data provided by the U.S. Census Bureau.
Total Population
Median Age
Population Density Population Density This is the number of people per square mile in a neighborhood.
Average individual Income
There's plenty to do around Garland TX Community & Neighborhood Guide, including shopping, dining, nightlife, parks, and more. Data provided by Walk Score and Yelp.
Explore popular things to do in the area, including Into the Well Collective, Fugitive Fitness, and Jobe Nails.
| Name | Category | Distance | Reviews |
Ratings by
Yelp
|
|---|---|---|---|---|
| Active | 1.07 miles | 7 reviews | 5/5 stars | |
| Active | 4.54 miles | 7 reviews | 4.9/5 stars | |
| Beauty | 4.86 miles | 7 reviews | 5/5 stars | |
| Beauty | 4.75 miles | 7 reviews | 4.6/5 stars | |
|
|
||||
|
|
||||
|
|
||||
|
|
||||
|
|
||||
|
|
Garland TX Community & Neighborhood Guide has 80,585 households, with an average household size of 15.36. Data provided by the U.S. Census Bureau. Here’s what the people living in Garland TX Community & Neighborhood Guide do for work — and how long it takes them to get there. Data provided by the U.S. Census Bureau. 244,806 people call Garland TX Community & Neighborhood Guide home. The population density is 4,355 and the largest age group is Data provided by the U.S. Census Bureau.
Total Population
Population Density Population Density This is the number of people per square mile in a neighborhood.
Median Age
Men vs Women
Population by Age Group
0-9 Years
10-17 Years
18-24 Years
25-64 Years
65-74 Years
75+ Years
Education Level
Total Households
Average Household Size
Average individual Income
Households with Children
With Children:
Without Children:
Marital Status
Blue vs White Collar Workers
Blue Collar:
White Collar:
We don’t evaluate Prosper using city-wide averages alone. Prosper is a neighborhood-driven market where school zoning, subdivision design, and new construction cycles can change buyer demand and resale competition quickly.
When we advise clients on Prosper, we compare neighborhoods by build era, amenity profile, commute patterns, lot size expectations, and how resale inventory competes with nearby new construction. That’s how you avoid picking the wrong neighborhood for your lifestyle, or overpaying for a location premium that doesn’t hold in the next resale cycle.
• Predominantly newer construction and master-planned communities
• Neighborhood choice matters here more than city-wide averages
• Demand is influenced by school zoning, amenities, and commute corridors
• Expect active development, retail expansion, and ongoing infrastructure grow
Find out why our clients and our team of expert agents are the happiest in the Dallas-Fort Worth Metroplex. We are thrilled to have the opportunity to work with you!